


Introduction
Welcome, everyone!
In this blog, we'll look at the Rich Text Experience features in both Dataverse and Canvas Apps. While these controls have some limits, we'll push the limits by using HTML to enhance your Rich Text experience in both applications.
Let's explore the exciting possibilities by leveraging HTML control and enhance your Rich Text experience
Sample Scenario
For this scenario, I'll consider a sample project that is in the scoping phase where necessary details are captured. To enhance further, Rich Text controls are used to display detailed and structured layouts. Rich Text Components/Control/Editors do exist in Dataverse as well as Canvas Application.
Both work great up to a certain extent until users want to add Tables for example.
In Dataverse, we do have the option to add Tables but we don't have the same in Rich Text Editor for canvas Applications.
Canvas App - Rich Text Control allowed formats and limitations
Model-Driven App - Rich Text Control Details
Let's try to add a detailed Table layout in Canvas Application that we can use in Dataverse
Implementation Steps
For this blog, we will be utilizing collections to display our HTML content.
Also, I used ChatGPT to quickly generate sample record data.
Getting Data
Step 1: I am using a collection that will be leveraged in HTML Table.
I have a collection that has 3 columns:
Section - Determines which section the data should go
Field - Determines fields in that section
Value - Determines values for the respective field
Click here to see the Collection Code
Using HTML Control to Display a Table
Do check out my blog on how to leverage simple HTML Tables using Collection - Blog Link
Step 2: Add HTML control in your Canvas App.
Following Properties for the HTML control:
- Items -
"<table width='100%' style='border: 1px solid black; border-collapse: collapse;'>"
    & "<tr><td colspan='2' style='border-bottom: 1px solid black; padding: 5px; width: 30%;'><b>Project Overview</b></td></tr>"
    & Concat(
        Filter(
            colScopingData,
            Section = "Project Overview"
        ),
        "<tr><td style='padding: 5px; width: 30%;'>" & Field & "</td><td style='padding: 5px;'>" & Value & "</td></tr>"
    )
    & "<tr><td colspan='2' style='border-top: 1px solid black; border-bottom: 1px solid black; padding: 5px; width: 30%;'><b>Scoping Process</b></td></tr>"
    & Concat(
        Filter(
            colScopingData,
            Section = "Scoping Process"
        ),
        "<tr><td style='padding: 5px; width: 30%;'>" & Field & "</td><td style='padding: 5px;'>" & Value & "</td></tr>"
    )
    & "<tr><td colspan='2' style='border-top: 1px solid black; border-bottom: 1px solid black; padding: 5px; width: 30%;'><b>Scope Boundaries</b></td></tr>"
    & Concat(
        Filter(
            colScopingData,
            Section = "Scope Boundaries"
        ),
        "<tr><td style='padding: 5px; width: 30%;'>" & Field & "</td><td style='padding: 5px;'>" & Value & "</td></tr>"
    )
    & "<tr><td colspan='2' style='border-bottom: 1px solid black; padding: 5px; width: 30%;'><b>Scope Verification and Acceptance</b></td></tr>"
    & Concat(
        Filter(
            colScopingData,
            Section = "Scope Verification and Acceptance"
        ),
        "<tr><td style='padding: 5px; width: 30%;'>" & Field & "</td><td style='padding: 5px;'>" & Value & "</td></tr>"
    )
    & "</table>"
- AutoHeight (optional) -
True
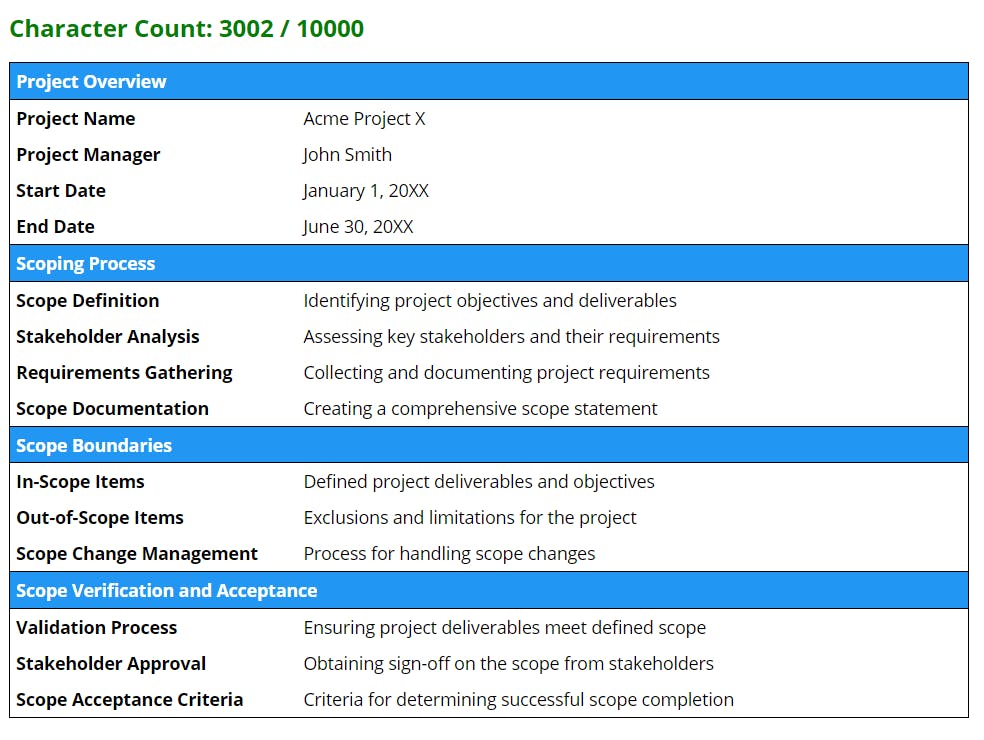
This is how it will look like: (Note at the end about Character Count)
Leverage this Table in your Dataverse Record
Step 3: I'll be showing you 2 possible ways of pushing the data to your Dataverse Record.
Method 1: Overwrite Data
Here, you can directly patch the record to your Column where Rich Text is supported.
You can patch the Column as follows:
Patch(
    <datasource>,
    <record>,
    {
        'Detailed Information': HTMLControl.HtmlText
    }
)
Method 2: Insert or Append Data
You can append your Text by using concatenate function to join previous data and your HTML data just like
Append
 With(
     {
         RecordData: LookUp(<datasource>, <record>, ThisRecord)
     },
     Patch
     (
         <datasource>, <record>,
         {
             'Detailed Information': Concatenate(RecordData.'Detailed Information', HTMLControl.HtmlText)
         }
     )
 )
Insert to a specific location
We will use a substitute to insert the HTML data.
I used "#TABLE#" as a identifier where data needs to be added
With(
    {
        RecordData: LookUp(<datasource>, <record>, ThisRecord)
    },
    Patch
    (
        <datasource>, <record>,
        {
            'Detailed Information': Substitute(RecordData.'Detailed Information', "#TABLE#", HTMLControl.HtmlText)
        }
    )
)
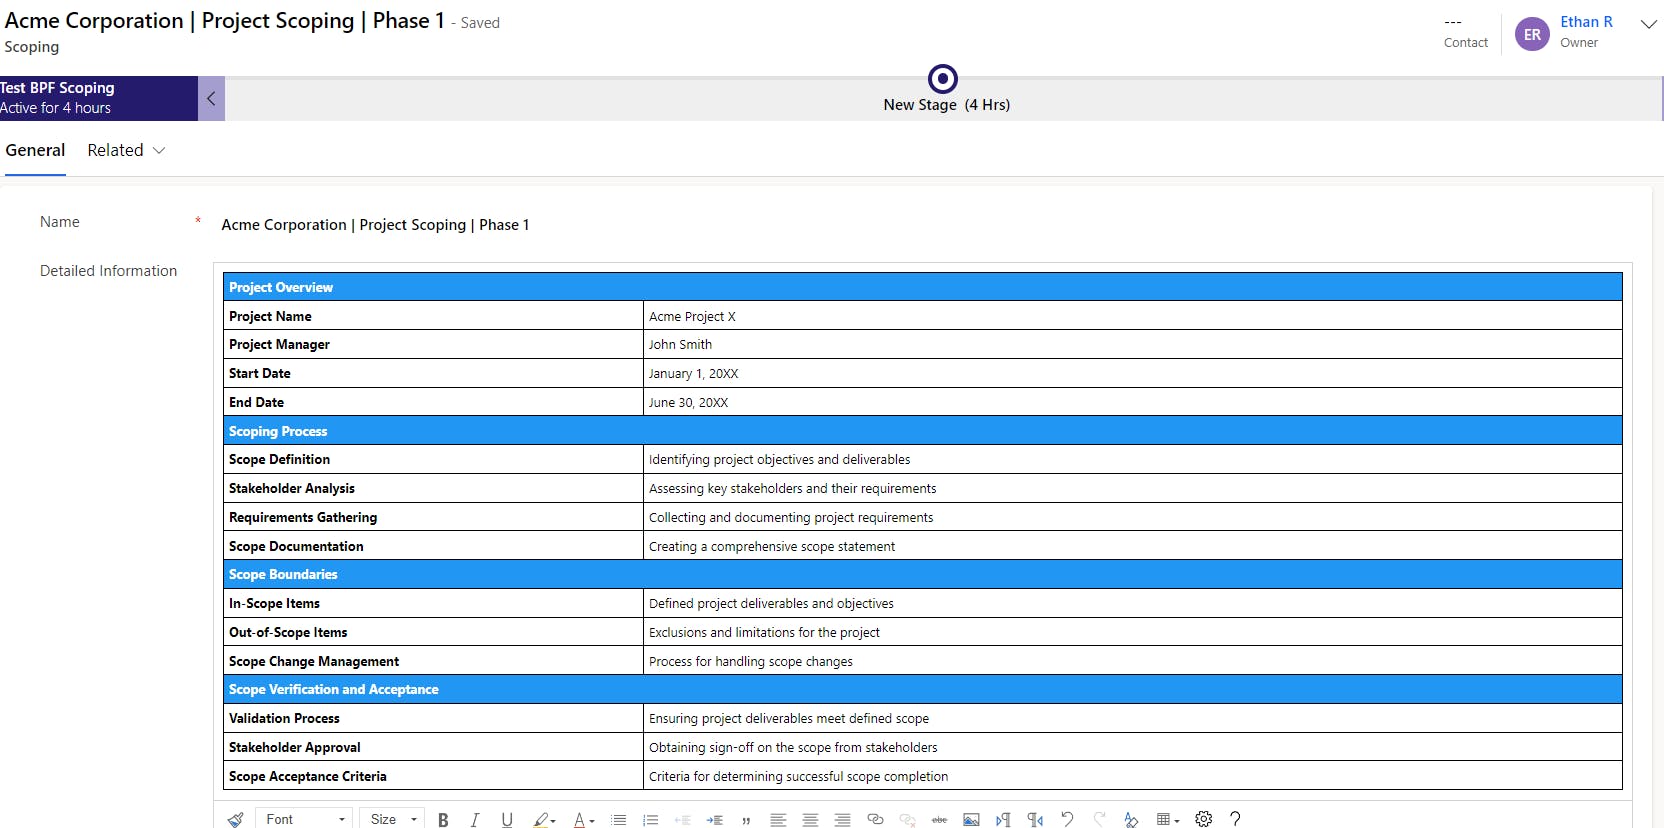
Output
As you see, you get the full experience of using Tabular data in Dataverse.
Key Points to Note
Always keep the character count in your mind as the column in Dataverse has limits, keep a counter or visual cue for the user to see when the HTML data crosses the limit.
Use Custom CSS Styling to make the experience better as advanced styling is not possible on both platforms but using HTML control, you can deploy rich layouts + charts + icons and more
DO NOT USE div containers with box shadows in your HTML control which will be patched in dataverse, this will repeat the div for every line user enters and create issues in your experience. So keep it simple.
Your Rich Text Editor won't show you the HTML Layout as per limitation but this doesn't mean the formatting is gone.
Summary
That's it! I hope you found this article useful, and I encourage you to experiment with HTML control and enhance your Rich Text experience to meet your specific needs.
Reference Materials
My Blog to Convert Collection to HTML Table - Create HTML Table from Collections in Canvas PowerApps
Concatenate formula - Microsoft Documentation
Substitute function - Microsoft Documentation